![]()
Adobe Acrobat Professional 2017
Useful to organize (e.g., combine, rearrange, highlight, edit, comment) and view pdf files. allows you to take multiple pdf files.
AMBER 9.0, 10.0 (University of California, San Francisco)
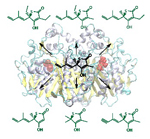
AMBER is a Unix-based suite of programs designed for efficient structure building and molecular dynamics. Our group uses various facets of this suite such as LEaP, antechamber, and sander for building, minimization and conformational sampling of structures of empirically studied biomolecular ions (lipids, nucleotides, natural products). This data is used to elucidate experimental measurements by calculating the prevailing conformational arrangements of biomolecular ions in the gas phase.
Antechamber
antechamber is used as a preparatory tool for LEaP. It allows the conversion of various file types, as well as the generation of Amber prep files using restrained electrostatic potential charge (RESP) fitting for LEaP. Additionally, Antechamber assigns atom types based on the user selected force field.
sander
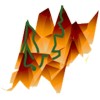
sander is used for energy minimization and conformational sampling. The force field used by Sander during conformational sampling is a set of equilibrium functions that describe bond, bond angles, electrostatic and other non-covalent interactions based on classical (Newtonian) physics derivations. An example set of such functions is shown below:
![]()
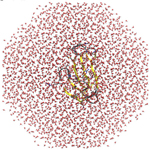
Molecular dynamics based conformational sampling is achieved by heating a given structure to high temperature, then cooling random high temperature snapshots very gradually to a low temperature plateau. Cooled structures can be compared based on their relative energies, conformation and theoretical collision cross section generated by MOBCAL (see below).
 LEaP
LEaP
LEaP is used to prepare input files for AMBER based molecular dynamics studies. Biomolecular ions of interest can be built in LEaP. LEaP also generates topology, parameter, and internal coordinate files for sander.
 ChemDraw Professional 16 (formerly ChemBioOffice; PerkinElmer)
ChemBioOffice is a suite of programs that allow you to draw, analyze, fragment, etc. molecules. This program suite is available free through the Chemistry Department. This suite include ChemBioDraw, ChemBio3D, and a few different ChemFinder programs. The latter of which may only find limited utility in our lab.
![]()
ChemBioDraw
ChemBioDraw allows for visualization of molecules. There are many ways to construct possible analytes that you may encounter. One way is to use one of the many templates available (seen as a button on the left hand side toolbar) to construct peptides, oligonucleotides, oligosaccharides etc. Similarly you can also press “Ctrl + Shift + n” and bring up a convert name to structure function that is incredibly useful. Structures that are copied from a ChemDraw workbook and pasted into recent releases of Microsoft Office programs (Word, Excel, Powerpoint) can be edited post-paste by double clicking on the structure. This is useful when having to move, shift, or rearrange structures so that you don’t have to return to the root file to modify the molecule. This program primarily renders structures in Fisher style projections and so can not be used for anything beyond primary structural analysis.
![]()
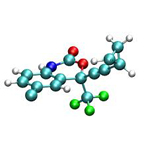
ChemBio3D
ChemBio3D as its name implies is more suited for 3-dimensional visualization of molecules. It can accept structures straight from ChemBioDraw either imported or as straight copy-and-paste. This program allows you to import and export structure files as pdb format which can be quite useful when quickly drawing up a structure to export to AMBER or other programs where drawing from scratch is not as easy. It also provides some molecular dynamics capabilities (the effectiveness of which has yet to be determined by our lab).
 Data Explorer 4.8 (Applied Biosystems)
Data Explorer is the data analysis software that works with the ‘Voyager Control Panel’ on the Voyager STR instrument. Although it is useful for viewing and analyzing data you may want to export to Origin to allow full customization of plotted spectra. This software has shown perfect compatability with Windows XP, however, when using Vista various portions of installation require you to temporarily turn User Account Control (UAC) off and/or restart the computer multiple times before first use.
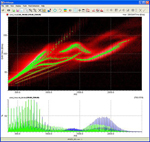 DriftScope 2.9 Mobility Environment (Waters)
This software is used with the Synapt instrument systems and includes automated peak detection algorithms, visualization tools and data export functions.

EndNote X7 (Clarivate Analytics)
Our lab uses EndNote for reference management when writing publications. The program is available through the Vanderbilt Software Store.
 Gaussian 03
Gaussian is a powerful program for performing quantum mechanical calculations. In our lab it is used primarily for structure minimization, frequency and electrostatic potential calculations. Gaussian allows quantum mechanical treatment of molecules with user defined basis sets.
 MassHunter IM-MS Browser (Agilent)
MassHunter is used for instrument control, data acquisition, qualitative and quantitative data analysis, and reporting for Agilent time-of-flight (TOF), quadrupole time-of-flight (Q-TOF), ICP-MS, and triple quadrupole systems.
 MassLynx 4.1 (Waters)
MassLynx 4.1 is suite of programs that our lab uses primarily to view data from the Synapt instrument. There are several programs that can be used when visualizing this type of data. The ‘Chromatogram’ program opens a spectral trace of the ion current throughout the duration of the sample run. Upon right clicking and dragging over a portion of this trace a 2-D (m/z vs. intensity) graph is generated in ‘Spectrum’ from the selected data. From here it is possible to analyze and also export this data in various forms. You can also copy the peak list and paste it into a notebook file and then import into programs such as Excel or Origin to allow for more customization of plots. The last program that will be mentioned in this package is DriftScope which is used for visualizing 3-D IM-MS data. Recently DriftScope 2.0 was released which included some additional options such as flipping the axes to allow m/z to be on the abscissa and arrival time distribution to be on the ordinate. It is also now possible to remove the lines from the plot area.
 Mass Profiler 10.0 (Agilent)
Part of Agilent’s MassHunter software, this a chemometrics platform used for statistical analysis and visualization of GC/MS, LC/MS, CE/MS and ICP-MS data.
 Matlab 2016 (Mathworks)
Matlab is a programming language used for numerical computing and enables matrix manipulations, function and data plotting, algorithm implementation, user interface creation, and interfacing with other programs (e.g., C, C++, C#, Java, Fortran and Python).

MOBCAL, N2 parameterized (Shvartsburg and Jarrold)
MOBCAL is a Fortran program developed in Martin Jarrold’s group at Northwestern University. Mobcal calculates collision cross section based on structure of input molecules using either a projection model or trajectory calculation (based on hard sphere or Lennard Jones potential). Mobcal is especially recommended for collision cross section calculations of intermediate and large size molecules.
The MOBCAL version we utilize has been specifically parameterized for nitrogen drift gas:
- Campuzano I, Bush MF, Robinson CV, Beaumont C, Richardson K, Kim H, Kim HI. Structural characterization of drug-like compounds by ion mobility mass spectrometry: comparison of theoretical and experimentally derived nitrogen collision cross sections, Analytical Chemistry, 2011 Dec 27;84(2):1026-33.
- Kim H, Kim HI, Johnson PV, Beegle LW, Beauchamp JL, Goddard WA, Kanik I. Experimental and theoretical investigation into the correlation between mass and ion mobility for choline and other ammonium cations in N2, Analytical Chemistry, 2008 Mar 15;80(6):1928-36.
 Prism 8 (GraphPad)
We use Prism to organize, analyze, and graph our research data. It is available for download in the Vanderbilt Software Store.

Projected Superposition Approximation (PSA) Online Calculator (Florida State University)
http://psa.chem.fsu.edu/login
 SIMION Ion and Electron Optics Simulator 8.1 (Scientific Instrument Services, Inc.)
An optics simulation program used to calculate charged particle trajectories and electric fields.