Results & Discussion
Results
General Outcomes
Breakpoint (derived from PRA)
- Average= FR 16.8
- Median= FR 14
Pmax (derived from PFRA)
- Average= FR 7.9
- Median= FR 7
Schedule of Reinforcment (during baseline of extinction challenge)
- Average= FR 9.2
- Median= FR 7
Rate of Responging (during last 3 sessions of baseline)
- Average= 14.6 responses per minute
- Median= 9.73 responses per minute
Rate of Reinforcement (during last 3 sessions of baseline)
- Average= 2.5 reinforcers per minute
- Median= 1.4 reinforcers per minute
During extinction:
- Average responses emitted= 112.3
- Average reinforcers “missed”= 18
- Average latency to extinction or dissent= 224.3 seconds
According to the definition, 37.7% (26/69) participants emitted an extinction burst with an average rate of responding= 13.4 responses per minute.
Between-Groups Differences
Between-group differences were considered in relation to for participants randomized to EO and AO conditions, and again for participants randomized to cheap and expensive conditions.
Independent Effects of Timing & Unit Price
Control
As planned, we did not find significant (P<0.05) differences between the groups in breakpoints or Pmax values of target reinforcers for either comparison (i.e., Cheap vs. Expensive, EO vs. AO) following randomization.Within the EO vs. AO comparison, there was no significant differences in schedules of baseline reinforcement or in the average rate of responding during baseline. There were marginally significant (P=0.057) differences between the accumulated rates of baseline reinforcement. In the Cheap vs. Expensive comparison, there were significant (p<0.05) differences between the baseline reinforcement schedules and between the aggregate rates of reinforcement during baseline as expected; as well as a marginally significant (p=0.055) differences in average rates of baseline responding.
Therefore, all of the values associated with the pre-extinction parameters, with the possible exception of differences between the rate of responding within the EO vs. AO comparison, suggests that our experimental setup was adequately controlled, allowing us to examine the individual effects of value-parameter manipulations during our test.
Test
Between pre-extinction value parameters with relation to demand (i.e., EO/AO), there were statistically significant (p<0.05) differences in performances during extinction, across all of the considered variables. Extinction bursts occurred in 57.6% (19/33) of participants in EO conditions but only 19.4% (7/36) of AO participants. Significant between-group differences also occurred for peak response rates, peak response rate during extinction depicted as a proportion of baseline responding, total responses emitted during extinction, total reinforcers “missed” during extinction, and latencies to extinction.
One the other hand, when the pre-extinction value parameters associated with unit price (i.e., cheap/ expensive) were manipulated, there were not significant differences in the percentage of participants who exhibited extinction bursts (cheap- 38.2%; expensive- 37.1%) or in peak rates of responding considered as proportions of baseline. Further, marginal significant differences (p=0.062) were found in latencies to extinction. Statistical significance (p<0.05) in differences in peak rates of responding, total responses emitted during extinction, and the total reinforcers “missed” during extinction.
Price-by-Timing Interactions
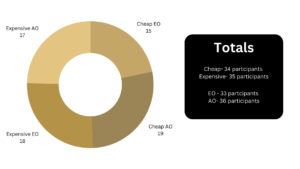
In consideration of price-by-timing interactions, extinction bursts were observed for 46.7% (7/15) of participants in Cheap EO, 31.6% (6/19) of participants in Cheap AO, 67% (12/18) of Expensive EO participants, and 5.9% (1/17) of participants in Expensive AO. Further, the Expensive AO decreased the percentage of extinction bursts significantly to below chance levels as well as relative to the percentages from the Expensive EO condition. Additionally, a marginally significant (p= 0.058) decrease of the percentage of bursts in relation to the Cheap AO conditions. Therefore, we found a statistically significant (0.027) difference in the price-by-timing interaction in relation to its effect on bursts.
There was a statistically significant price-by-timing interaction relating to the total number responses emitted, as well as a marginally significant (p=0.059) interaction in relation to total number of “missed” reinforcers during extinction between the groups.
We did not find a significant price-by-demand interaction for peak response rates, peak response rates considered as proportion of baseline, or in latencies to extinction across the groups.
Discussion
In this study, we manipulated pre-extinction variables based on two empirical measures of value (demand, Pmax) to investigate their effects on responding during extinction. We found that each of these measures could independently influence target responding, and they also interacted in unexpected ways. Notably, the timing of extinction relative to consumption approximating demand consistently produced robust differences between groups in extinction measures. Participants whose reinforcer consumption before extinction did not approximate their self-established demand were more likely to persist in responding and escalate their behavior before stopping. Additionally, we found that expensive baseline schedules did not significantly impact persistence and escalation measures, but they did affect other performance measures. The study also revealed that no manipulation guaranteed the occurrence or absence of bursts for all participants. These findings highlight the complex interactions of various variables influencing extinction and bursting, requiring further investigation for effective treatments of challenging behavior. The study’s methodology, using a hybrid approach of single-case and randomized group design, provided valuable insights into the phenomenon of bursts and their mitigation possibilities.