Dynamics of the Golgi complex during interphase » fucci
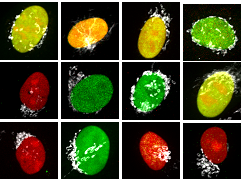
Fucci cycle indicator was used to exhibit that as cell cycle progresses from G1 (red) to S-phase (yellow) to G2 (green), the Golgi complex (white) localizes around the equator of the nucleus.

Fucci cycle indicator was used to exhibit that as cell cycle progresses from G1 (red) to S-phase (yellow) to G2 (green), the Golgi complex (white) localizes around the equator of the nucleus.