Our Research Project

Serial Queuing of Information Processing in the Human Brain

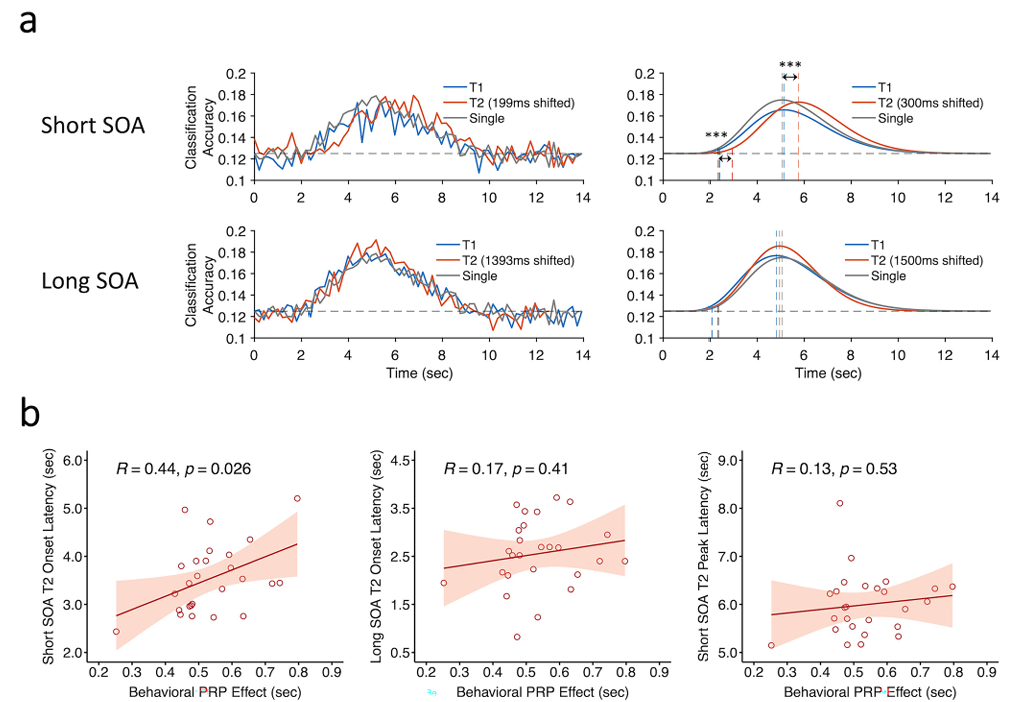
The human brain is heralded for its massive parallel processing capacity, yet influential cognitive models suggest that there is a central bottleneck of information processing distinct from perceptual and motor stages that limits our ability to carry out two cognitively demanding tasks at once, resulting in the serial queuing of task information processing. Here we used ultrafast (199 ms TR), high-field (7T) fMRI with multivariate analyses to distinguish brain activity between two arbitrary sensorimotor response selection tasks when the tasks were temporally overlapping. We observed serial processing of task specific activity in the fronto-parietal multiple-demand (MD) network, while processing in earlier sensory stages unfolded largely in parallel. Moreover, the MD network combined with modality-specific motor areas to define the functional characteristic of the central bottleneck at the stage of response selection. These results provide direct neural evidence for serial queuing of information processing and pinpoint the neural substrates undergirding the central bottleneck.

  • Yue, Q., Newton, A. T., & Marois, R. (2025). Ultrafast fMRI reveals serial queuing of information processing during multitasking in the human brain. Nature Communications16(1), 3057. doi: 10.1038/s41467-025-58228-0. [PDF]
Yue,2025,fig7
Fig. 7 | Timecourses ofsingle-task and dual-task decoding in the MDnetwork. a The group-averaged classification accuracy time series in the MD network. The upper graphs show results of task-specific decoding for the short-SOA dual-task trials and the lower graphs for the long-SOAdual-task trials. The left column shows the raw decoding results and the right column shows the fitted curves of the decoding results. Dashed gray lines represent the chance levels (12.5%) and the colored vertical dashed lines indicate decoding peak latencies and onset latencies. b Correlations between individuals’ fMRI decoding measures (peak latency and onsetlatency) andmagnitudeofthebehavioralPRP(RT2differencebetweenshort andlong-SOAdual-taskconditions).Hollowdotsrepresentindividualdata.Thered line represents a linear fit and the shaded ribbon represents the standard error. Asterisks indicate significantly postponed T2 decoding peak latencies and onset latencies in the short-SOA dual-task trials (marked by the red vertical line) relative to the single-task trials (marked by the gray vertical line): peak latency, ***p =3.7×10⁻⁶, N=26, paired-sample t-test, two-tailed; onset latency, ***p =9.79×10⁻⁵, N=26, paired-sample t-test, two-tailed. Note that the raw time courses in the left panels could only be shifted by multiples of TRs to the nearest SOAs (199ms and 1393ms) whereas the curve-fitted data could be shifted by the exact SOAs (300ms and 1500ms). MD multiple-demand, SOA stimulus-onset asynchrony, PRP psychological refractory period. Source data are provided as a Source Data file (Yue et al., 2025).