Climate Change
We are developing tools to facilitate using the NetsBlox system to download and analyze data on climates in Earth’s past. Examples include measurements of carbon dioxide concentrations and temperature for the last 800,000 years of Earth’s history that were recorded in the massive ice cap that covers Antarctica. Students will use NetsBlox to organize and analyze this data, producing graphs that show changes over time and relationships between different properties of the climate system.
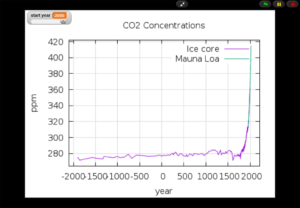
One such example is shown below where the CO2 concentrations have been plotted for the past 4000 years using ice core data from NOAA and actual measurements from the observatory in Hawaii. Click on the image to view the NetsBlox project, see the code used to create the figure, and play with the slider to go back in time 800,000 years!
Other data sources utilized in NetsBlox include global and local temperature trend estimates and sea-level information from the Berkeley Earth Institute.