Using antecedent exercise to reduce young children’s challenging behaviors
 Authors: Claire R. Winchester, Erin E. Barton & Gabrielle Trimlett
Research questions
- For preschool-aged children demonstrating challenging behavior, does an intervention involving teacher-directed moderate-to-vigorous physical activity result in (a) a reduction in challenging behavior during subsequent classroom activities, and (b) an increase in overall levels of engagement during subsequent classroom activities?
- Do social validity raters masked to study conditions differentially rate participants’ behavior?
- Are participants’ behaviors similar in level to a normative group of children from the same classroom?
- Do social validity raters masked to study conditions rate participants’ behavior as comparable to a normative group of children from the same classroom?
MODIFIED INTERVENTION QUESTION
- Does an intervention package including teacher-directed moderate-to-vigorous physical activity and a visual support result in (a) a greater reduction in challenging behavior, and (b) a greater increase in overall engagement than teacher-directed moderate-to-vigorous physical activity alone?
Definitions and participant’s information
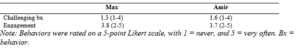
Table 1. Operational definitions of dependent variables.

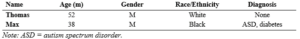
Table 2. Participant demographic information.
Data of IOA and PF
Table 3. IOA results for all dependent variables.
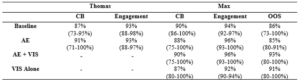
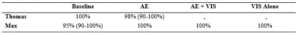
Table 4. Procedural fidelity data.
Graphs
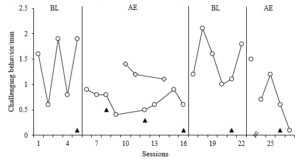
Figure 1. Challenging behavior results (IOA) – Thomas. Open circles represent challenging behavior during typical sessions; open diamonds represent challenging behavior during sessions in which a substitute teacher conducted morning circle. Closed triangles represent peer challenging behavior data.
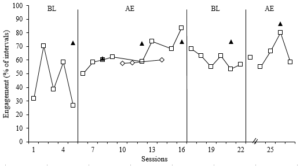
Figure 2. Engagement results (IOA) – Thomas. Open squares represent engagement during typical sessions; open diamonds represent challenging behavior during sessions in which a substitute teacher conducted morning circle. Closed triangles represent peer engagement data.
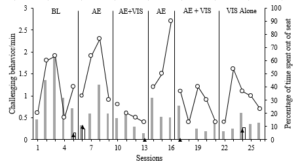
Figure 3. Challenging behavior results (IOA) – Max. Gray bars represent percent of session spent out-of-seat; open circles represent all other challenging behaviors during typical sessions. White bars represent percent of sessions spent out of seat for the peer; closed triangles represent peer challenging behavior data.
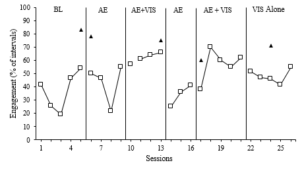
Figure 4. Engagement results (IOA) – Max. Open squares represent engagement data during typical sessions. Closed triangles represent peer challenging behavior data.
Social Validity Data
Table 5. Social validity of outcomes results.
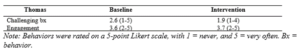
Table 6. Comparative social validity results.